The Hidden Risk: Circular Dependencies in Observability
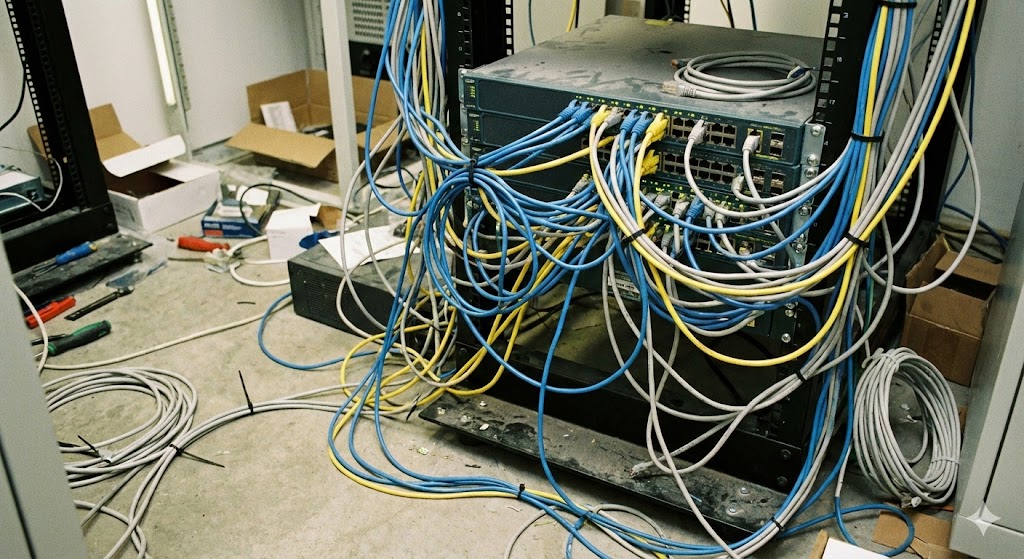
When an incident hits, your monitoring stack should be the most reliable system in the house. But what happens when your observability pipeline depends on the same Kubernetes clusters, service meshes, and infrastructure it's supposed to observe? That's a circular dependency — and it's a silent reliability killer.
At Airbnb, thousands of services rely on shared infrastructure. Their metrics pipeline was built on top of the very systems it needed to monitor. When those systems failed, dashboards went dark, alerts stopped firing, and the tools meant to guide recovery became part of the outage. This is not an uncommon story. As organizations consolidate onto platforms like Kubernetes and Istio, the risk grows.
The solution? Treat your observability stack as a production system whose availability must exceed that of what it observes. Here's how Airbnb did it.

Isolating Compute: Dedicated Clusters Without the Overhead
Airbnb's observability team faced two extremes:
- Run on shared production clusters — minimal ops overhead, but tightly coupled to the applications being monitored.
- Operate their own Kubernetes clusters — full isolation, but heavy operational burden.
Neither worked. The first introduced circular dependencies; the second was unsustainable for a small team.
Their "just right" solution: dedicated Kubernetes clusters managed by the Cloud team but not shared with product or infrastructure workloads. This preserved Kubernetes as a managed foundation while reducing shared failure domains.
# Example: Dedicated observability cluster manifest (simplified)
apiVersion: v1
kind: Namespace
metadata:
  name: observability
---
apiVersion: v1
kind: ResourceQuota
metadata:
  name: observability-quota
  namespace: observability
spec:
  hard:
    requests.cpu: "100"
    requests.memory: "200Gi"
    limits.cpu: "200"
    limits.memory: "400Gi"
    persistentvolumeclaims: "10"
To keep it reliable, they coordinate changes with the Cloud team so only one major change lands at a time, and changes are validated on lower-priority clusters first.
Rethinking Networking: Breaking Free from the Service Mesh
Observability traffic is uniquely high-volume — orders of magnitude more than business traffic. Airbnb uses Istio as its service mesh, but relying on the same data plane for monitoring and business traffic created a circular dependency. Worse, telemetry spikes could degrade application traffic.
Their solution: a custom Layer 7 network ingress layer based on Envoy, running independent of the shared compute layer. This proxy load-balances traffic and routes read/write requests to the right backends.
# Example: Envoy configuration snippet for observability ingress
static_resources:
  listeners:
  - name: observability_ingress
    address:
      socket_address:
        address: 0.0.0.0
        port_value: 9090
    filter_chains:
    - filters:
      - name: envoy.filters.network.http_connection_manager
        typed_config:
          "@type": type.googleapis.com/envoy.extensions.filters.network.http_connection_manager.v3.HttpConnectionManager
          stat_prefix: ingress_http
          route_config:
            name: local_route
            virtual_hosts:
            - name: backend
              domains: ["*"]
              routes:
              - match:
                  prefix: "/api/v1/write"
                route:
                  cluster: metrics_backend
                  timeout: 5s
          http_filters:
          - name: envoy.filters.http.router
This decoupling unlocked header-based routing — each of Airbnb's 1,000+ services maps to a specific cluster backend via a tenant header. It also enables mirroring metrics to alternate destinations and fine-grained access control.
For more on building production-ready systems, check out Beyond Demos: Building Production-Ready AI Agents with Gemini 3 & 6 Open-Source Frameworks.
Monitoring the Monitors: Meta-Monitoring with a Dead Man's Switch
Once you've built resilience into your metrics pipeline, how do you know when the metrics engine itself is broken? Airbnb runs a separate set of Prometheus instances dedicated to monitoring the observability stack — isolated from the observability stack's own Kubernetes nodes and in different availability zones.
But what if that meta-monitoring layer fails? Instead of infinite recursion, they use a Dead Man's Switch:
- A Prometheus alerting rule that always fires as long as scraping is healthy.
- Alertmanager continuously sends these alerts to an external AWS SNS topic.
- A CloudWatch alarm monitors the rate of incoming messages.
- If messages stop — because Prometheus is down, scraping stalled, or Alertmanager can't send — the alarm triggers and on-call is paged.
# Example: Dead Man's Switch alerting rule
# prometheus-rules.yaml
groups:
- name: meta-monitoring
  rules:
  - alert: DeadMansSwitch
    expr: vector(1)
    labels:
      severity: none
    annotations:
      summary: "Dead Man's Switch — I am alive"
This ensures that even if your monitoring of the monitors goes silent, you still get paged.
Limitations and Caveats
- Cost: Running dedicated clusters and custom networking adds infrastructure cost. Airbnb deemed it worthwhile for reliability, but smaller organizations might find simpler approaches (e.g., multi-cloud metrics backends) more cost-effective.
- Complexity: Managing your own Envoy-based ingress layer requires deep networking expertise. Not every team has that.
- Meta-monitoring still has blind spots: A dead man's switch tells you the signal stopped, but not always why. You'll still need logs and traces to root-cause meta-monitoring failures.
Next Steps for Learning
- Dive into Kubernetes operator patterns for building custom controllers that manage observability infrastructure.
- Study Envoy's HTTP connection manager for advanced routing and fault injection.
- Explore Prometheus high-availability setups with Thanos or Cortex for multi-cluster aggregation.

Conclusion: Treat Monitoring as a Production System
Airbnb's journey shows that reliable monitoring requires designing for uncomfortable moments — partial outages, degraded networks, failing dependencies. The principles generalize beyond any specific tech stack:
- Map critical dependencies in your observability pipeline.
- Isolate failure domains — don't let your monitoring share the same compute and network as your applications.
- Always have an independent path for the signals that drive paging and incident response.
By treating monitoring as a production system whose availability must exceed what it observes, you preserve visibility during incidents, speed recovery, and build confidence for your users and your business.
For more on cross-platform reliability patterns, see On-Device Function Calling Goes Cross-Platform Inside Google AI Edge Gallery's Latest Update.
Thanks to the Airbnb Observability team for sharing their approach. All product names and logos are property of their respective owners.