Why Most Customer Feedback Is Misleading
As developers and product builders, we often pride ourselves on being data-driven. We set up analytics, run A/B tests, and send out NPS surveys. But if you've ever shipped a feature based on user requests only to see it ignored, you've already felt the gap between what users say and what they actually do.
A landmark study on Dutch verbal probability terms (see source) showed that even simple words like "possible" vs. "probable" are interpreted wildly differently. When users tell you "I need a comparison table," they might actually need a way to make a confident purchase decision—and a table is just one possible solution.
To build truly useful software, we must move beyond asking and start observing. The framework by Hannah Shamji—Four Levels of Customer Understanding—provides a practical ladder to climb from surface opinions to deep, actionable insights.

The Four Levels: From Surface to Root Cause
Level 1: What They Say
This is the easiest data to collect (surveys, support tickets, feature requests) but the most unreliable. People filter their answers through social desirability, memory gaps, and context they assume you already know.
Level 2: What They Think and Feel
Interviews and diary studies give more context, but are still colored by how users want to be perceived. A user might say a feature is "intuitive" because they don't want to admit confusion.
Level 3: What They Do
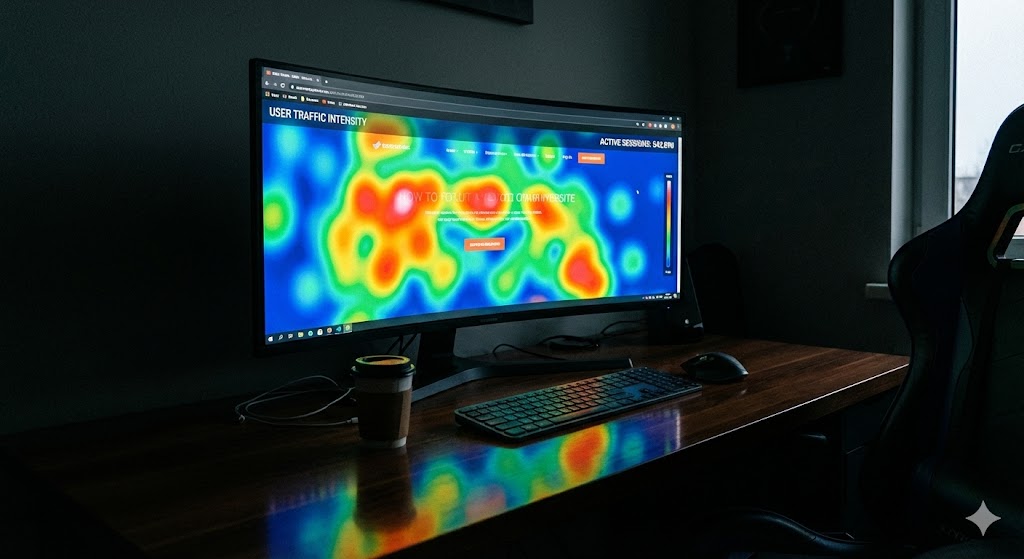
This is where analytics, session recordings, and task analysis shine. You observe actual behavior—clicks, hesitations, scrolls, repeated actions. This is the gold standard for diagnosing usability issues.
Level 4: Why They Do It
The deepest level. Requires building trust through repeated observations and contextual inquiry. You uncover underlying motivations, fears, and workarounds that users themselves may not be aware of.
# Example: Simple session analysis to detect hesitation patterns
import pandas as pd

def detect_hesitations(session_data):
    """
    Analyze mouse hover and click data to find points of confusion.
    Parameters:
        session_data (DataFrame): columns [timestamp, event_type, element_id]
    Returns:
        List of elements where user hovered > 2 seconds without clicking.
    """
    hesitations = []
    grouped = session_data.groupby('element_id')
    for element, events in grouped:
        hovers = events[events['event_type'] == 'hover']
        clicks = events[events['event_type'] == 'click']
        if len(hovers) > 0 and len(clicks) == 0:
            # User hovered but never clicked – potential confusion point
            avg_hover_time = hovers['timestamp'].diff().mean()
            if avg_hover_time > 2.0:
                hesitations.append(element)
    return hesitations
This code snippet helps you automatically flag UI elements that cause hesitation—a concrete way to operationalize Level 3 understanding.

Practical Tactics to Uncover Real Needs
You don't need an expensive UX lab. Here are low-cost, high-impact methods:
- Exposure Hours: Require every team member (including engineers) to spend 2 hours every 6–8 weeks watching real users use the product.
- Live UX Testing: Invite the whole company to observe a 30-minute usability test. No slides, no reports—just raw observation.
- Helpdesk Deep Dive: Every quarter, read the last 50 support tickets and categorize them by root cause. You'll spot patterns that surveys miss.
- Co-design Sessions: Show users 3 rough prototypes and ask them to rank and explain their choice. Watch how they interact, not just what they say.
A Critical Caveat: Don't Validate, Diagnose
Many teams use user testing to "validate" their assumptions. This is backward. Your goal is to diagnose existing behavior without preconceived notions. As Alin Buda argues, our job is not to empathetically absorb someone else's experience, but to act on their problems. Emotions are signals, not conclusions.
For a deeper dive into why breadth of knowledge matters in this context, check out our related article on why the data generalist wins in the age of AI.
Conclusion: Build Products, Not Echo Chambers
The most impactful product decisions come from triangulating across all four levels of understanding. Don't stop at what users say. Observe what they do, uncover why they do it, and let that guide your roadmap.
Your next step: Pick one feature you're planning this sprint. Before writing a single line of code, schedule three 20-minute observation sessions with real users. Watch them try to solve the problem your feature aims to fix. You'll be surprised what you learn.
Limitations & Cautions
- Observational research is time-intensive. Balance it with quantitative data to avoid over-indexing on a few users.
- User behavior can change when they know they're being watched (Hawthorne effect). Use passive analytics to supplement direct observation.
- Cultural context matters. For example, users in Brazil may express frustration more openly than users in Japan. Always account for cultural norms in your interpretation.
Next Learning Path
- Read "Deploy Empathy" by Michele Hansen for practical interviewing techniques.
- Explore the Nemotron-Personas-Brazil dataset for culturally-aware AI training data.
- Practice creating an emotion wheel for your product's user journey to capture nuanced emotional signals.